What a Very Strong El Niño Means for Western Snowpack
Past winters and this year's forecast show the same split across the West.
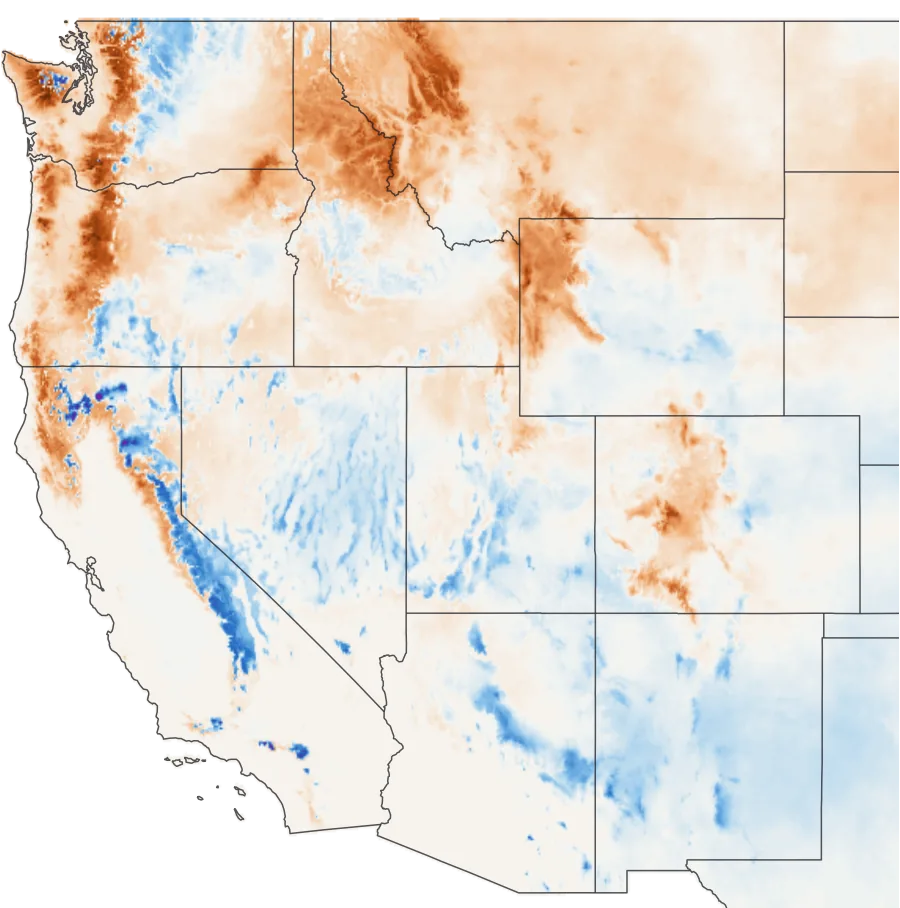
Past very strong El Niños
1982–83, 1991–92, 1997–98 and 2015–16
ECMWF forecast, 2026–27
November run
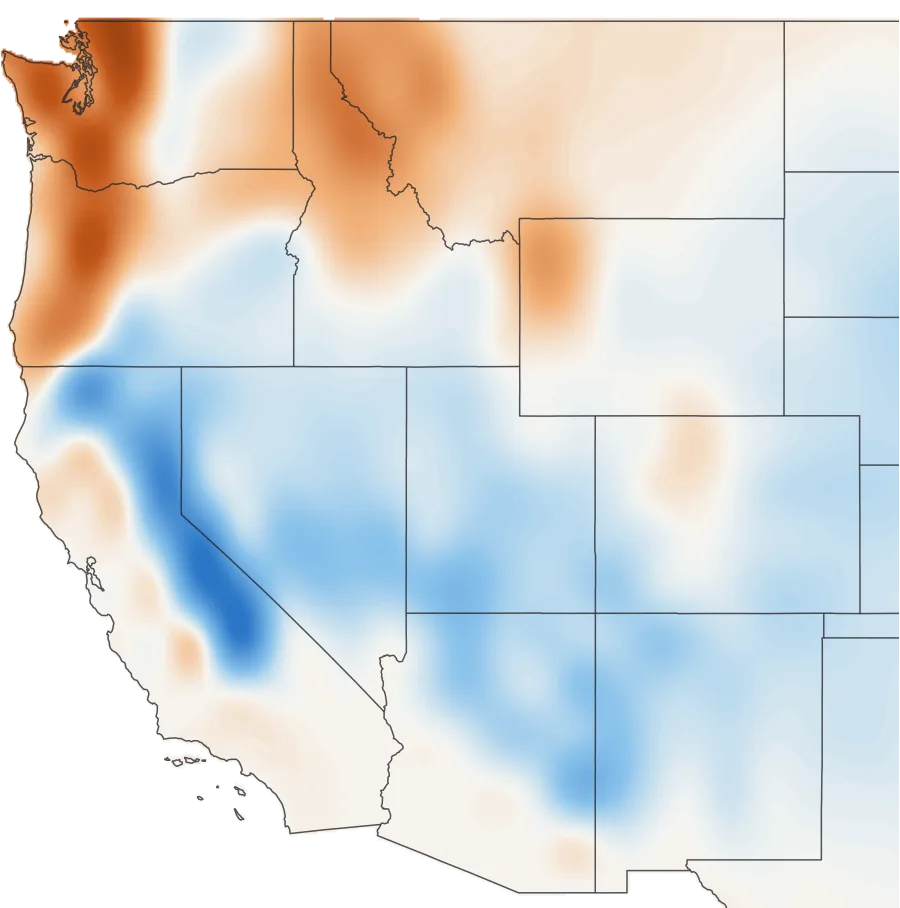
December–March snowfall against normal, in inches of water. The past winters are estimated from gridMET precipitation and temperature.20 The forecast is compared with ECMWF's 1993–2016 average, and its grid, about 60 miles wide, can't see individual ranges.21
- The south leans deep, the north leans thin. Arizona, New Mexico and southern Utah run well above other winters. The Northern Rockies beat median in just 2 of 14 El Niños.
- The Wasatch, Summit County and central Idaho have no reliable signal.
- Stronger doesn't mean more. The Sierra's four very strong winters ranged from 53% to 228% of median.
- In the Cascades, elevation decides it. Oregon's lowest stations held 59% of median in very strong winters. Its highest held 105%.
- The models agree with history. ECMWF shows the same split, and six North American models all run wet in the Sierra and dry in the Northern Rockies.7
Snowpack through the winter
Snow water equivalent, inches
Colors show average April 1 snowpack as a percent of each station's median. Gray stations started too recently.
Region by region
| Region | Past El Niños | ECMWF, 2026–27 | Our read |
|---|---|---|---|
| Washington Cascades | −19 | −3.2 in | Leans low, worst at low elevation |
| Oregon Cascades | −22 | −1.6 in | Mixed; low elevations at risk |
| Inland Northwest | −12 | −0.4 in | Leans slightly low |
| Northern Rockies | −21 | −1.7 in | Strongest lean low |
| Central Idaho | −7 | −0.4 in | No clear signal |
| Greater Yellowstone | −11 | −0.7 in | Leans slightly low |
| Sierra Nevada | +18 | +4.6 in | Leans high, with a huge range |
| Nevada Ranges | +4 | +0.9 in | Leans high on the long record |
| Northern Utah | 0 | +0.6 in | No clear signal |
| Southern Utah | +35 | +1.8 in | Leans high |
| Northern Colorado | +3 | −0.2 in | No clear signal |
| Southern Colorado | +20 | +0.7 in | Leans high, late |
| Arizona & New Mexico | +85 | +1.5 in | Strongest lean high, from a thin base |
Past El Niños: April 1 snowpack against all other winters, in points of median, from 571 SNOTEL stations. ECMWF: December–March snowfall against normal, in inches of water. Our read is a judgment call, not a forecast.
This winter
- NOAA expects "a strong-to-very strong El Niño" through January–March 2027.1 It gives an 83% chance of passing +2.5°C on its official index, RONI, in October–December. The record is +2.4.
- RONI adds a fourth very strong winter most coverage skips: 1991–92, a poor snow year across most of the West.3
- The North Pacific looks different. The Pacific Decadal Oscillation read −2.26 in October, and it averaged +0.2 to +1.4 in the four earlier winters.8 NOAA says its influence "may be minimal."6
- It follows "the worst winter on record for snow accumulation" in Colorado, Utah and Wyoming.18
What the research says
- NOAA, October 2026: "Below-normal precipitation is favored for much of interior Alaska, the Northern Rockies and High Plains," with above-normal favored for "much of California, the Southwest."6
- Cayan, 1996: described the Northwest–Southwest snowpack seesaw.10
- Clark et al., 2001: El Niño's effects on snowpack are generally weaker than La Niña's.11
- Hoell et al., 2016: "Significant increases in wet probabilities occur during strong El Niño events across the entire state" of California, though "the small sample size makes it difficult to draw general conclusions."13
- NOAA Climate.gov, 2018: "the strength of the El Niño event doesn't really predict the strength of the impacts."15
- Mote et al., 2018: "over 90% of snow monitoring sites with long records across the western US now show declines."16 A deep El Niño pack now starts from a lower base.
How we did this
Snowpack is April 1 SWE from 571 SNOTEL stations and 654 snow courses,2 as total SWE over total median, the NRCS method. Winters are classed by NOAA's RONI table. The snowfall map is gridMET precipitation falling below about 1°C; its winter totals track April 1 SWE at 670 SNOTEL stations with a median correlation of 0.80. Four winters is a tiny sample, and composites describe the past. They don't predict this winter.
Does El Niño mean more snow in the West?
In the southern half, usually. Arizona, New Mexico, southern Utah, southern Colorado and the Sierra tend to finish above other winters. The Northern Rockies and Washington Cascades tend to finish below. The middle of the West shows little signal.
Is El Niño good for skiing in Utah?
Southern Utah, yes: it beat median in 12 of 14 El Niños. For the Wasatch and northern Utah, there's no reliable effect in either direction.
Is El Niño good for skiing in Colorado?
The San Juans and southern mountains lean better than usual, especially late in the season. Northern Colorado, including Summit County, is close to a coin flip.
Does El Niño mean a big Tahoe winter?
It raises the odds without promising much. The Sierra finished between 53% and 228% of median in the four very strong El Niños. The long record favors it, and all six models we checked run wet.
What does El Niño do to Pacific Northwest snow?
It tends to mean less, mainly at lower elevations. High Cascades stations held near median in very strong El Niños, while the lowest third fell to 59% in Oregon and 75% in Washington.
Is 2026–27 a "super" El Niño?
It's on track. "Super" isn't an official term, but NOAA's own threshold for the strongest event since 1950 is +2.5°C on RONI, and it gives an 83% chance of passing that in October–December.
Sources
- NOAA Climate Prediction Center, ENSO Diagnostic Discussion, October 8, 2026.
- USDA NRCS National Water and Climate Center, AWDB web service: SNOTEL and snow course data. Provisional data, subject to revision.
- NOAA, Relative Oceanic Niño Index: What's Changing and Why It Matters, 2026; RONI data table.
- NOAA CPC, Prognostic Discussion for Long-Lead Seasonal Outlooks, October 15, 2026.
- NOAA CPC, North American Multi-Model Ensemble data, October 2026 run.
- NOAA NCEI, ERSST v5 PDO index.
- Cayan, D. R. (1996). Interannual climate variability and snowpack in the western United States. Journal of Climate 9(5), 928–948.
- Clark, M. P., Serreze, M. C. & McCabe, G. J. (2001). Historical effects of El Niño and La Niña events on the seasonal evolution of the montane snowpack in the Columbia and Colorado River Basins. Water Resources Research 37(3), 741–757.
- Hoell, A. et al. (2016). Does El Niño intensity matter for California precipitation? Geophysical Research Letters 43(2), 819–825.
- Lindsey, R. (2018). Snow during El Niños from 1950 to 2009. NOAA Climate.gov, with analysis by Stephen Baxter.
- Mote, P. W. et al. (2018). Dramatic declines in snowpack in the western US. npj Climate and Atmospheric Science 1, 2.
- Western Water Assessment, 2025–2026 Extreme Snow Drought in the Intermountain West, May 14, 2026.
- Abatzoglou, J. T. (2013). Development of gridded surface meteorological data for ecological applications and modelling. International Journal of Climatology 33(1), 121–131 (gridMET).
- ECMWF SEAS5, November 2026 run, through the Copernicus Climate Data Store. Contains modified Copernicus Climate Change Service information 2026. Neither the European Commission nor ECMWF is responsible for any use of it here.